Skip to content


Social platforms generate plenty of data, but not every number deserves equal attention. That is why social media KPIs matter: they connect performance data with clear business goals and show whether your efforts are actually moving in the right direction. More importantly, the right KPIs can highlight what is driving growth, where performance is falling short, and which areas deserve more focus. At The Ocean Wide, we use those insights to turn social media data into clearer, more confident marketing decisions.
What Are Social Media KPIs?
Social media KPIs are measurable indicators used to judge progress towards a specific marketing or business objective. A platform may provide hundreds of metrics, but only the ones tied to your goals become meaningful KPIs.
Reach, for example, is simply a metric until brand awareness becomes a defined objective. The difference matters because strong reporting should explain performance rather than collect numbers.
Terms such as social media key performance indicators and social key performance indicators describe the same goal-focused approach. A clear social media content strategy makes it easier to decide which numbers deserve that role.

How Do You Choose The Right KPIs For Social Media?
The right social media KPIs depend on what the business wants social media to achieve. Awareness campaigns need different measures from lead generation, ecommerce, community building, or customer support.
Keep the selection focused enough that every KPI can answer a practical question. If a number would not influence a decision, it probably does not deserve priority in the report.
Start With A Clear Business Goal
Start with the result the business wants to achieve, such as greater awareness, more website traffic, stronger engagement, qualified leads, or sales. Once that objective is clear, it becomes easier to identify which metrics deserve attention and which ones can stay in the background.

Match Each Goal With A Small Set Of KPIs
Avoid tracking every number available. Instead, choose a small group of KPIs that directly reflects the goal, such as reach for awareness, engagement rate for audience response, or conversion rate for lead and sales performance.
Set A Baseline And Target
Targets need context. Start with recent performance, then set a realistic improvement based on business priorities, budget, audience size, and campaign maturity.
Instead of “increase engagement”, define the result more clearly. A goal might target a higher engagement rate over the next quarter or a specific number of qualified enquiries from social channels.

Define The Reporting Period
Choose a timeframe that fits the goal. Weekly reviews can catch short-term issues, while monthly or quarterly reports are better for broader trends. Keep the reporting period consistent so comparisons remain meaningful.
Which Social Media KPIs Should You Track?
The most useful social media marketing KPIs cover different stages of performance, from visibility and engagement to traffic, conversions, and customer response. The key is to track the metrics that reflect your actual goals rather than every number available in the dashboard.
Reach
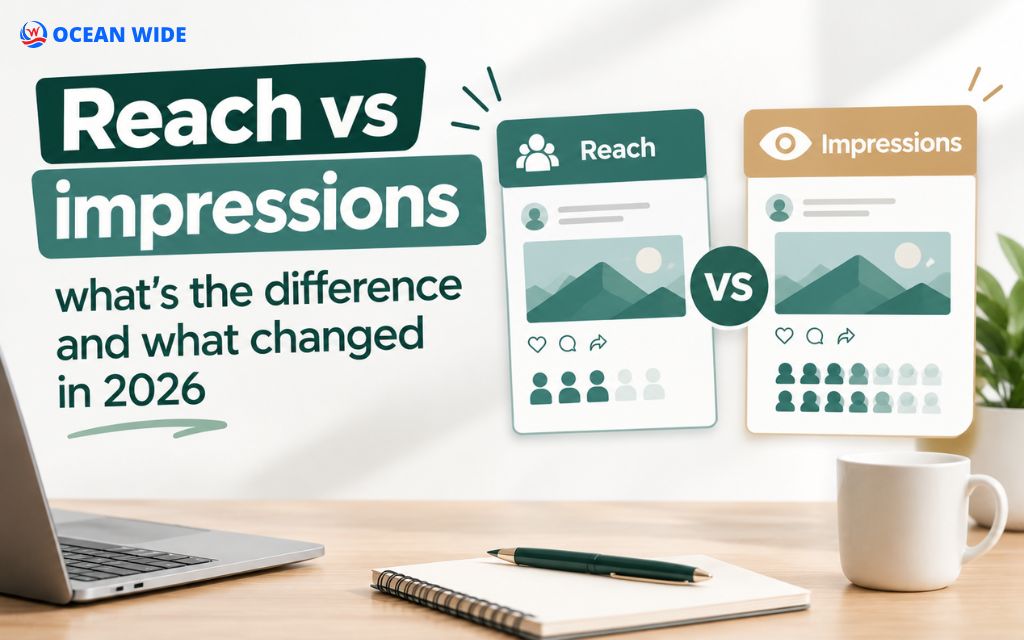
Reach measures the number of unique people who saw your content. It is especially useful when the goal is brand visibility or exposure to new audiences.
Do not judge reach in isolation. Compare it with previous periods, campaign activity, audience growth, and engagement to understand whether increased visibility also attracts meaningful attention.

Impressions Or Views
Impressions generally show how often content appears, while views can measure exposure to specific content formats such as video. Definitions differ between platforms, so always check what each platform counts.
Repeated exposure is not automatically good or bad. Compare impressions with reach to understand how frequently people encounter the content. Consistency matters more than forcing different platform definitions into one identical number.
Audience Growth Rate
Raw follower count says little about momentum. Audience growth rate shows how quickly the community expands relative to its existing size.
A simple formula is:
Audience Growth Rate = New Followers ÷ Total Followers × 100
Use the same calculation method across each reporting period. Growth should also be read alongside engagement because a larger audience has limited value if fewer people interact with the content.

Engagement Rate
Engagement rate puts interactions into context by comparing them with audience size, reach, or impressions. Likes, comments, shares, saves, and other interactions may form part of the calculation.
Choose one formula and keep it consistent across reports. A sudden change in calculation method can make performance appear stronger or weaker without any actual behavioural change.
Shares And Saves
Shares indicate that someone considered the content worth passing to another person. Saves suggest enough value to return later. Both can reveal more intent than a quick like, particularly for educational posts, guides, checklists, tutorials, and useful resources.
Video Watch Time And Completion Rate
A video view alone cannot tell you whether someone stayed for the message. Watch time and completion rate provide a clearer picture of audience retention. Low retention near the beginning may point to a weak opening or unclear value while strong retention can signal that the topic, pacing, and presentation hold attention.

Click-Through Rate
Click-through rate shows how often people click after seeing your content or ad. It becomes especially useful when the goal is to drive traffic, since a strong reach figure means little if very few users move beyond the platform.
CTR = Link Clicks ÷ Impressions × 100
Social Media Conversion Rate
Conversion rate measures how many users complete a desired action after arriving from social media. That action could be a purchase, booking, form submission, registration, or download, depending on the campaign goal.
Define the conversion clearly before launch so the final result reflects the outcome you actually want to measure.
Cost Per Lead
Cost per lead measures how much campaign spend is required to generate one lead. It helps compare audiences, campaigns, or ad sets, but price alone should not determine success.
CPL = Campaign Cost ÷ Leads Generated

Cost Per Acquisition
Cost per acquisition measures how much the business spends to generate a completed customer or another defined conversion. Unlike CPL, it looks further down the funnel and helps show whether initial interest is turning into real business outcomes.
CPA = Total Campaign Cost ÷ Acquisitions
Return On Ad Spend
Return on ad spend compares the revenue attributed to a paid campaign with the amount invested in advertising. When conversion tracking is reliable, ROAS gives businesses a clearer view of whether paid social is generating enough revenue to justify continued or increased spend.
ROAS = Revenue From Ads ÷ Ad Spend
Response Time
Response time measures how long customers wait for a reply after they contact the business through comments, DMs, or support messages. Since social media often becomes part of the customer journey before a purchase or enquiry, slow responses can weaken the experience even when the content itself performs well.
Which Social Media KPIs Match Different Business Goals?
Different goals call for different social media marketing KPIs, so the most useful approach is to match each objective with the metrics that best reflect progress.
- Brand awareness: Reach, impressions, audience growth
- Engagement: Engagement rate, comments, shares, saves
- Website traffic: Link clicks, CTR, social sessions
- Lead generation: Leads, conversion rate, CPL
- Sales: Conversion rate, CPA, ROAS
- Customer care: Response time, resolution rate

How Should You Measure Social Media KPIs Across Platforms?
Each platform measures audience behaviour a little differently, so social media KPIs should not be compared without context. The most reliable approach is to keep your definitions consistent, review performance within each platform, and use website analytics to understand what happens after users leave social media.
Keep Metric Definitions Consistent
Decide how each KPI will be calculated and use the same method from one reporting period to the next. Engagement rate, for example, may be based on followers, reach, or impressions, but switching formulas can make performance look better or worse without any real change.
Compare Trends Within Each Platform
Raw numbers from different platforms do not always tell the same story. Audience behaviour, content formats, and distribution systems vary, so Instagram reach should not be treated as directly equivalent to reach on another channel.
Instead, compare each platform with its own previous performance. Month-over-month or campaign-to-campaign trends can show whether your strategy is improving in the environment where the content actually appears.

Use Website Analytics For Off-Platform Results
Platform analytics are useful for reach, views, and engagement, but they cannot always show what users do after they click through. Website analytics can connect social traffic with actions such as form submissions, bookings, purchases, or other conversions.
Use consistent tracking links and conversion events so social performance can be followed beyond the platform and tied back to meaningful business outcomes.

How Do You Turn Social Media KPI Data Into Better Decisions?
Useful social media KPIs should lead to action, not just fill a report. Once the numbers are in place, the next step is to compare them with past performance, look for patterns that repeat, and use those insights to adjust the strategy.
- Compare results against previous periods to understand whether performance is actually improving
- Look for repeatable patterns across content, campaigns, and audience responses
- Change the strategy when the data consistently points to a stronger direction
What Social Media KPI Mistakes Should You Avoid?
Keep your social media KPIs focused, consistent, and tied to clear business goals by avoiding these common mistakes:
- Tracking every available metric
- Focusing too heavily on likes
- Using follower count without context
- Comparing unlike platform metrics directly
- Changing formulas between reports
- Ignoring conversion and cost data
- Reporting numbers without explaining changes
- Reacting to one unusually strong post
- Tracking KPIs unrelated to business goals
- Reviewing performance without clear next steps

Make Social Media Performance Easier To Understand With The Ocean Wide
Social media data becomes far more useful when it supports clear decisions instead of adding more noise. At The Ocean Wide, we help businesses connect content, paid campaigns, audience activity, and reporting through a more focused Social Marketing Service built around measurable goals.
Our strength lies in bringing strategy and performance together. We look beyond surface-level numbers to identify which content earns attention, which campaigns generate action, and where budget or creative direction may need to change. That gives you clearer reporting, stronger priorities, and a better sense of how social media contributes to wider business growth.

If you want a social strategy that is easier to understand and easier to improve, we can help. Call us at (720) 334-0899 to discuss your goals and build a more performance-focused approach to social media.
Final Thoughts
The value of social media KPIs comes from the decisions they support, not the number of metrics in a report. When each KPI connects to a clear goal and is reviewed in the right context, performance becomes easier to understand and improve. Over time, that creates a more focused social strategy, clearer priorities, and stronger confidence in where to invest next.