Skip to content

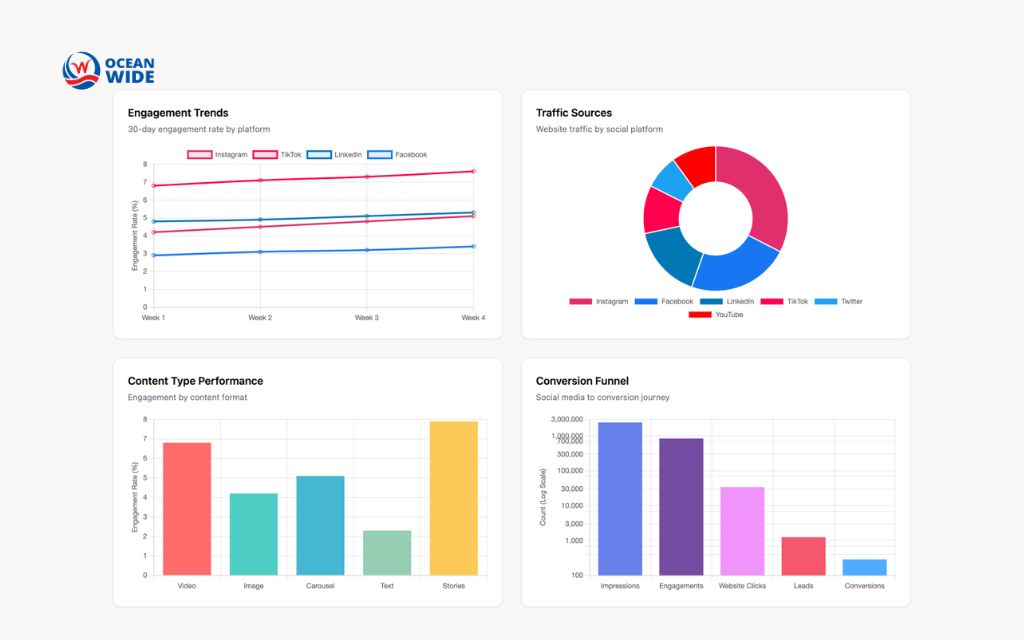
Social media reports lose value when no one can explain what changed or why. Numbers sit in separate apps, exports pile up, and each stakeholder asks for a different view. One social media dashboard fixes that by pulling your results into a single place.
This guide explains what a social media dashboard is, which metrics belong on it, and how to build one that supports real decisions. You will also find dashboard examples, tool options, and answers to common questions.
What is a social media dashboard?
Think of a social media dashboard as a central workspace that gathers performance data from every social platform you use. It helps you track results, compare channels, and keep reporting consistent for everyone who reads it.
It tracks the numbers that explain results. Reach and impressions show visibility. Likes, comments, and shares show how people respond. Follower growth shows audience momentum. Clicks and conversions link social activity to business outcomes.
You organize these metrics by platform, campaign, and time period. That structure makes trends easy to compare and reports easy to repeat. Most dashboards also support brand monitoring, real-time alerts, and report generation. Still, the core value stays simple: one reliable view of performance for your whole team.
Why social media dashboards play a critical role in reporting
Reporting gets harder when it must serve several audiences. Leaders want business impact. Campaign owners want performance detail. Social teams want trend context. Without a shared system, each group tells the same story in a different format, and views of performance start to conflict.
One shared dashboard replaces scattered reports with a structured system:
- Centralized data. Pull every account into one view so all stakeholders quote the same numbers.
- Trend visibility. Watch reach, engagement, and conversions side by side and catch shifts without hopping between apps. Some networks refresh certain metrics once a day or slower, so check update timing for each source.
- Consistent formats. Use the same metric definitions across campaigns, channels, and teams so results compare cleanly.
- Added signals. Place brand mentions and audience activity next to performance data to see what drives results.
- Automated reporting. Skip manual exports and copy-paste. Build reports that arrive ready for review.
- Faster decisions. Spend your time on analysis instead of compiling, so you can decide what to scale, fix, or drop.
- Team alignment. Share one view across roles. Management platforms also add content calendars, approval flows, and a unified inbox for faster replies.

What should a social media dashboard include?
Core metrics by reporting focus
Group your metrics into seven reporting areas. Each area below names the metrics to track and what they tell you:
- Visibility: Track reach, views, impressions, and video views. Check how far content travels and whether distribution rises or falls on each platform.
- Engagement quality: Track engagement rate, comments, shares, and saves. Separate active responses from passive viewing.
- Audience growth: Track net follower growth, growth rate, and demographics. Confirm that growth matches the audience you want to reach.
- Content performance: Track top posts, click-through rate, and posting frequency. Find the formats and themes that win again and again.
- Traffic and conversions: Track link clicks, conversions, revenue, and cost per click for paid posts. Tie social activity to visits, leads, and sales.
- Brand perception: Track brand mentions, sentiment, and trending topics. See how people talk about you beyond your own posts.
- Competitive position: Track share of voice, competitor engagement, and mention volume. Benchmark against peers in your category.
Note: Pick the areas that match your reporting goal. Executive summaries, campaign reviews, and daily operations checks each need a different mix.
Organic vs paid social metrics
Organic metrics measure unpaid posts: reach, engagement rate, follower growth, and link clicks. Paid metrics measure ad delivery and cost: spend, cost per click, cost per result, and conversions.
Report the two side by side, but never blend them. Ad-driven reach inflates organic totals and hides what your content earns on its own. Compare outcomes, such as cost per lead against organic leads, to see where effort pays off.
Why metric definitions differ across platforms
Each network defines metrics its own way, and definitions change. Meta, for example, has moved Facebook and Instagram toward a single views metric and is retiring impressions in its Page Insights API.
Engagement rate also has no single formula. Tools divide engagements by followers, reach, or impressions, and each choice gives a different rate. Pick one formula, apply it everywhere, and add a notes row to the dashboard that records every definition.
How dashboards differ for executive and operational teams
Executive dashboards show a small set of outcome metrics: reach trend, engagement trend, and conversions. Operational dashboards go deeper into channel performance, content breakdowns, and audience signals. Serving both audiences on one screen creates clutter, so build separate views.
Social media dashboard examples
Social media KPI dashboard
This dashboard tracks the indicators tied to your goals: engagement rate, reach, impressions or views, and click-through rate. It gives a high-level read on campaign health and shows where to improve.
Best for: Social media managers, marketing teams, and agencies that report to clients.

Social media management dashboard
This dashboard organizes publishing. It shows your content calendar, scheduled posts, and drafts across platforms, so teams plan, collaborate, and approve content in one place. That structure cuts errors and keeps posting consistent.
Best for: Teams that run several accounts or brands.

Social media monitoring dashboard
This dashboard follows brand mentions, hashtags, keywords, and sentiment as they happen. You see what people say about your brand across platforms and respond to feedback or issues early, which protects your reputation.
Best for: Brands with an active online presence and teams that watch public sentiment.

Social media analytics dashboard
This dashboard goes deep on audience demographics, behavior trends, and platform-specific results. It shows which content types and posting times work best and supports A/B tests through side-by-side comparisons.
Three analytics deserve regular attention:
- Seasonal trends: Track seasonal themes and events to keep content timely.
- Audience feedback: Review comments and replies, then work what you learn into future posts.
- Competitor activity: Watch competitors to find gaps and openings in your own plan.
Best for: Analysts and data-minded marketers who focus on return from social.

Social media engagement dashboard
This dashboard measures likes, comments, shares, and direct messages. It shows which content earns responses and how fast your team replies, which strengthens community relationships.
Best for: Community managers and brands that prioritize audience relationships.

Agency client reporting dashboard
Agencies need one view per client. Build a separate dashboard for each brand, limit access by role, and keep a consistent layout so clients read every report the same way. Add your branding where the tool allows it.
Include a short summary row that states what changed, why, and what happens next.
Best for: Agencies and consultants who report on several clients.

Best tools to build a social media dashboard
Hootsuite
Hootsuite offers one dashboard for networks including Facebook, Instagram, TikTok, X, LinkedIn, Pinterest, YouTube, and Threads. You can view organic and paid results side by side and drill down to post, page, or network level.
Pre-defined report templates cover quick snapshots and fuller reports. You can export results as CSV, XLSX, PDF, or PowerPoint files and share them with outside email addresses. Features vary by plan.
Best for: Teams that run many networks and need ready-made reports.
Zoho Social
Zoho Social groups analytics into audience, posts and engagement, performance, and reach and impressions. You can build custom reports with drag-and-drop stats, set custom date ranges, and schedule delivery daily, weekly, or monthly.
White-label reports carry your agency’s logo, which helps when you present results to clients.
Best for: Agencies and small teams that want scheduled, branded reports.
Looker Studio
Looker Studio, which Google’s documentation now calls Data Studio, is a no-cost tool for building dashboards and reports. It offers a drag-and-drop editor, charts, and viewer filters. You can share reports with your team or embed them in a web page.
Google lists connectors for its own products, plus community connectors that outside developers build. You can bring in social data through community connectors, and pricing varies by connector. Expect more setup work than a ready-made platform requires.
Best for: Budget-conscious teams that can handle data setup.
Sprout Social
Sprout Social offers reports for profile performance, post performance, tags, competitors, and paid results. Network reports cover Instagram, Facebook, X, Bluesky, Threads, TikTok, LinkedIn, YouTube, and Pinterest. It separates paid and organic performance and uses interactive charts.
Tag reports summarize tagged messages, covering volume, performance patterns, and campaign effectiveness.
Best for: Teams that compare campaigns and benchmark against competitors.
How to build a social media dashboard (step-by-step)
Building a dashboard means structuring the right data for the right audience. It does not mean adding more data. Follow these steps:
- Define the reporting objective: Decide who reads the dashboard and which decisions it supports. Executives need outcomes and trends. Campaign owners need channel-level results and content effectiveness.
- Select a focused set of KPIs: Choose metrics from visibility, engagement, growth, and outcomes. Start small and add a metric only when a decision needs it.
- Connect and combine data from your platforms: Link each account through the tool’s integrations, or load exports into a spreadsheet. Standardize metric names and date ranges so numbers from different networks line up.
- Structure the layout by platform, campaign, or timeframe: Group metrics consistently so trends and outliers stand out at a glance.
- Add context: Place mentions, audience activity, and top posts beside the numbers to explain what drives changes.
- Start from a template. Pre-built templates speed up setup. Adjust metrics and layout to your goals instead of designing from scratch.
- Automate collection and reporting: Connect all accounts, schedule report delivery, and keep data current without manual work.
- Review and refine: Remove metrics nobody uses and add views that improve clarity.
How to analyze dashboard data and improve performance
Your dashboard earns its place when it changes what you do next. Use this routine each review cycle:
- Compare against goals and prior periods: One number means little alone. Check each metric against your target and the last period.
- Find patterns: Look for formats, themes, and posting times that repeat wins or losses.
- Check the cause: Open the post, the campaign, or the platform change behind a spike or drop before you react.
- Change one thing at a time: Test a new format or schedule, then read the next period’s results.
- Report the story: Summarize what changed, why, and what you will do next in a few lines.
Conclusion
Your social media dashboard does more than track numbers. It shapes how your team reads data, aligns stakeholders, and acts on insight. The gap between a dashboard that reports activity and one that drives decisions comes down to structure, upkeep, and a short list of KPIs that match your goals.
Start small. Define one audience, pick a handful of metrics, connect your accounts, and refine the layout as questions come up. Clear visibility into performance helps you spend time on what works.
The Ocean Wide helps small businesses and startups turn scattered reports into clear decisions. If you want support with content, audience growth, and campaign optimization, our social media service gives you a partner who works through it with you. Call us at (720) 334-0899 today!
Frequently asked questions (FAQs)
What is the difference between a social media dashboard and a social media report?
Dashboards show data that updates for ongoing monitoring. Reports summarize a set period and add analysis and recommendations. Use the dashboard to watch performance, and use the report to explain it.
Can you build a social media dashboard for free?
Yes. Spreadsheets and Looker Studio let you build one at little or no cost. The tradeoffs include manual data entry or connector setup, fewer automated reports, and more upkeep as you add accounts. Compare that effort against the time a paid platform saves.
Which metrics should small businesses track first?
Start with reach or views, engagement rate, follower growth, link clicks, and conversions. These five cover visibility, response, audience, traffic, and results. Add metrics only when a decision requires them.
How do you combine data from multiple social media platforms?
Use one of three routes: enter data into a spreadsheet by hand, connect accounts through a reporting tool’s connectors, or use a management platform with built-in integrations. Whichever route you pick, standardize metric names, definitions, and date ranges first so numbers compare cleanly.
Do you need a social media management tool to build a dashboard?
No. Reporting tools and spreadsheets can build dashboards without publishing features. Management platforms add scheduling, a unified inbox, and approvals. Choose a management platform if your team needs those workflows. Choose a reporting tool if you only need to see and share results.
How can agencies share dashboards with clients?
Create one dashboard per client, limit access by role or send scheduled reports, and keep the layout the same across accounts. Some tools support white-label reports that carry your agency’s logo. Add a short summary of changes and next steps to every report.
Can you automate social media reporting?
Yes. Tools can collect data, refresh charts, and send reports on a schedule. Zoho Social, for example, delivers reports daily, weekly, or monthly. Automation cannot interpret the numbers, so add a short written takeaway and recommended action to each report.