Social media now serves as more than a place for engagement. Business owners and marketers in Denver and across the U.S. need platforms that drive measurable sales and leads.
Understanding how to turn likes, shares, and clicks into business outcomes determines your return on investment (ROI).
This guide breaks down what social media conversion rates mean, how to calculate them with precision, and how to optimize them using proven 2025 strategies. Let’s find out!
What is a social media conversion rate?
Your social media conversion rate measures how well your content, ads, or campaigns turn users into customers or leads. A conversion can mean different things based on your goals. Some businesses track purchases.
Others measure signups, downloads, form submissions, or any key action tied to marketing objectives. The metric shows whether your social media efforts generate real business value or just vanity metrics.
Which social media conversion goals matter?
Different business models need different conversion goals. The right key performance indicator aligns with where your audience sits in the buyer journey.
3 stages define most social media conversion tracking:
Awareness stage goals
Users at this stage need to discover your brand. Website visits from social posts tell you if your content attracts attention. Video views or story completions show whether your message holds interest. Profile follows or page likes indicate users want to see more from you.
Consideration stage goals
Users who reach this stage recognize their problem and evaluate solutions. Lead magnet downloads prove your content offers value. Newsletter signups show users want ongoing communication. Add-to-cart or “Book a Demo” clicks signal genuine purchase intent.
Decision stage goals
Users ready to convert need a clear path forward. Purchases or completed transactions represent the ultimate goal for e-commerce brands. Form submissions or quote requests work better for service businesses. Appointment bookings suit businesses that need face-to-face consultation.
How to calculate social media conversion rate
Formula
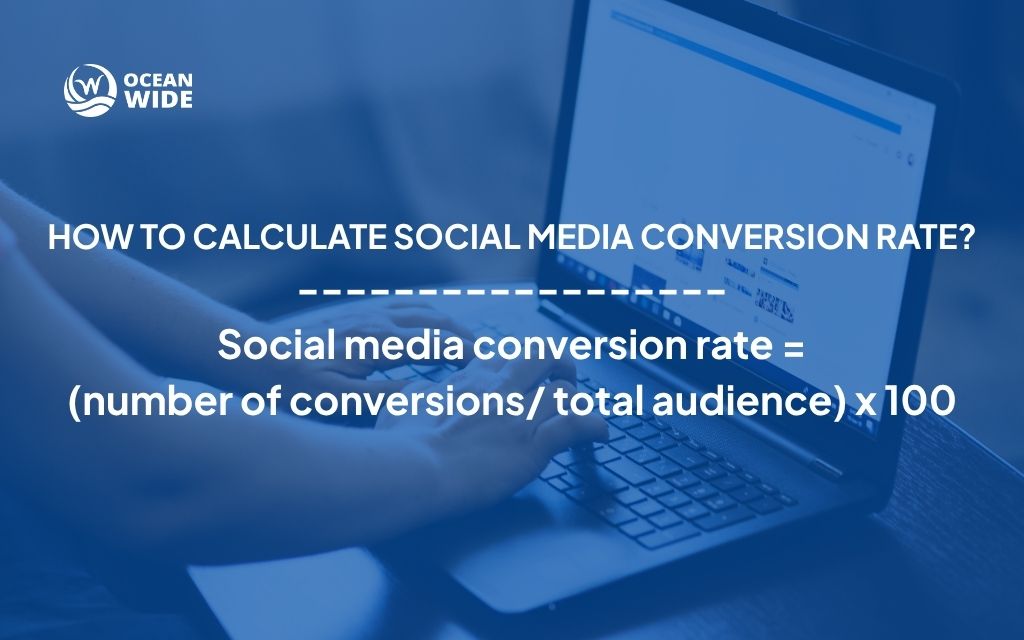
The formula is simple: Social media conversion rate = (number of conversions/ total audience) x 100
- Start by tracking total conversions from each platform using UTM links or pixels. These tools attribute conversions to specific campaigns.
- Next, divide conversions by total clicks, sessions, or reach depending on your goal. Multiply the result by 100 to get your percentage.
Consider this example. Your Instagram campaign drove 50 purchases from 1,000 visitors. The math works out to 50 divided by 1,000, multiplied by 100. Your conversion rate equals 5%.
Choosing the right metric
- Reach-based calculations measure conversion out of total audience exposure. This approach works when you want to understand overall campaign effectiveness.
- Click-based formulas provide more accuracy for paid ads or website traffic.
- Engagement-based metrics suit campaigns with softer goals like signups or form fills.
Always align your formula with your campaign objective. Sales campaigns need purchase-based calculations. Lead generation campaigns track form completions. Awareness campaigns might measure engagement or follow.
Average social media conversion rates (2025 benchmarks)
Understanding industry benchmarks helps you set realistic goals and identify improvement opportunities. These 2025 figures come from Sprinklr, HubSpot, and BusinessDasher studies across thousands of campaigns.
| Platform | TikTok | ||||
| Average conversion rate | 8.95% | 1 – 2% | 0.5 – 5% | 1 – 3% | 6.1% |
- Facebook maintains its lead with mature advertising systems and detailed targeting.
- Instagram excels when products tell visual stories.
- LinkedIn delivers higher-value B2B leads despite moderate percentages.
- TikTok generates awareness but requires follow-up campaigns for conversions.
- Pinterest operates early in the purchase journey where users browse rather than buy.
Top factors that affect social media conversion rate
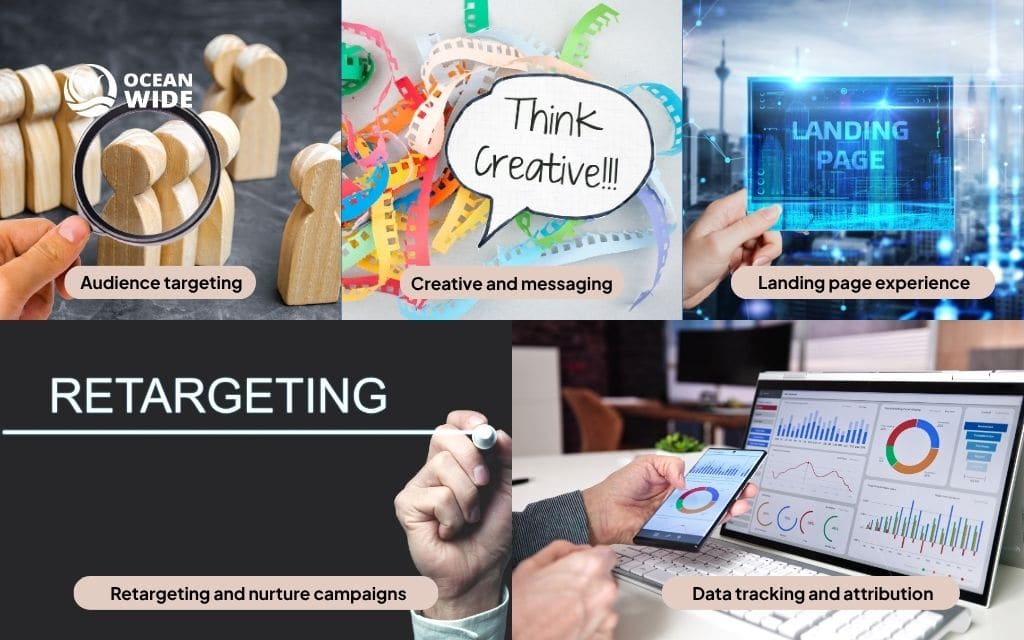
Nhắm mục tiêu đối tượng
Precise targeting ensures your message reaches the right demographics, interests, and buyer intent segments. Denver businesses competing in local markets need geographic targeting combined with behavioral data. National campaigns require more sophisticated audience segmentation based on purchase history and engagement patterns.
Creative and messaging
Clear calls to action (CTA) drive conversions. “Book Now” or “Shop Today” remove ambiguity about next steps. Relevant visuals that match your brand identity build trust. Consistent messaging from ad to landing page prevents confusion that kills conversions.
Landing page experience
Fast load times keep users engaged. Sites that load in under three seconds convert better than slower alternatives. Mobile responsiveness matters because most social media users browse on phones. Visual continuity from ad to landing page creates a seamless experience that feels intentional rather than jarring.
Retargeting and nurture campaigns
Users rarely convert on first contact. Re-engaging people who clicked but didn’t convert increases your overall conversion rate. Follow-up offers or reminders bring warm prospects back when they’re ready to buy.
Data tracking and attribution
Incorrect attribution makes conversions appear lower than reality. Pixels and UTM codes need proper setup across all platforms. Denver businesses running multi-platform campaigns need attribution models that credit the right channels for conversions.
Strategies to improve social media conversion rates
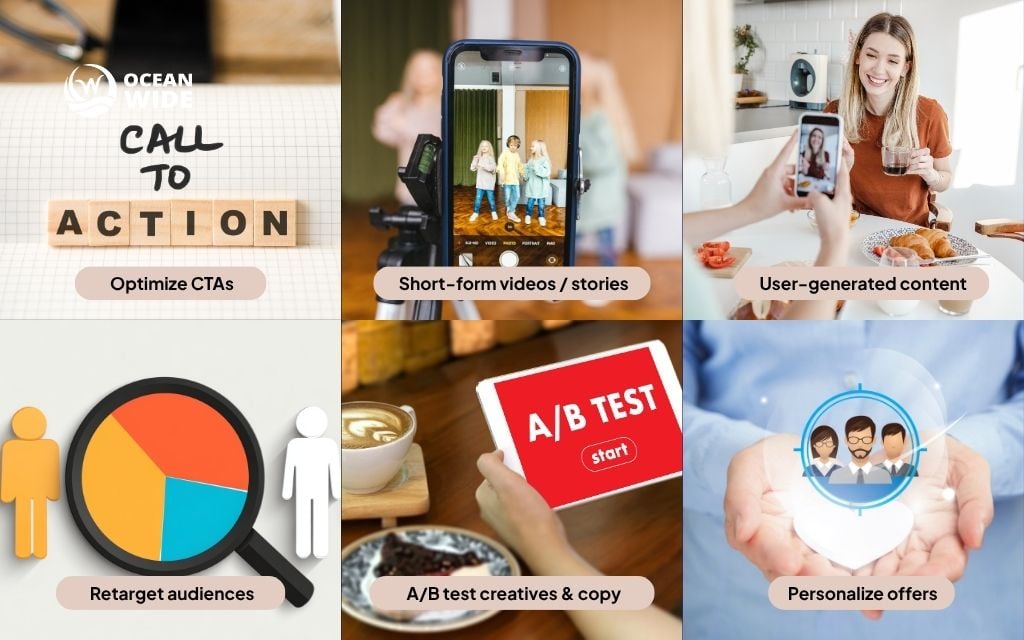
Optimize calls to action
Action-driven language removes hesitation. “Get your quote” or “Claim discount today” tell users exactly what happens next. Place CTAs above the fold so users see them without scrolling. Test different phrases to find what resonates with your audience.
Use short-form videos and stories
Motion captures attention better than static images. Showcase your offer through video to increase conversion rates by up to 80%. Behind-the-scenes content, product demonstrations, and customer testimonials work particularly well in video format.
Leverage user-generated content
Authentic customer testimonials and social proof build trust instantly. People trust other customers more than brand messaging. Share customer photos, reviews, and success stories to reduce purchase anxiety.
Retarget warm audiences
Users who engaged but didn’t buy represent your highest-value prospects. They already showed interest and understand your offer. Run follow-up ads with special offers or additional information to convert these warm leads.
A/B test creatives and copy
Small changes in headlines, images, or CTA color can boost conversions by 15 to 30%. Test one element at a time to isolate what drives results. Denver businesses can test local references against generic messaging to find what resonates with regional audiences.
Personalize offers
Dynamic ads or audience segmentation deliver messages tailored to user behavior. Someone who viewed product pages sees different ads than someone who only visited your homepage. Personalization makes users feel understood rather than targeted by generic marketing.
Tools to track and optimize conversion
Tracking tools
- Google Analytics 4 provides comprehensive tracking across your website and social platforms.
- Meta Pixel and TikTok Pixel track conversions from Facebook, Instagram, and TikTok campaigns.
- LinkedIn Insight Tag measures B2B conversions.
- HubSpot, Zoho, or Salesforce CRM systems connect social conversions to your sales pipeline.
Optimization tools
- Hotjar or Microsoft Clarity show heatmaps of user behavior on your landing pages. These tools reveal where users click, scroll, and abandon.
- Buffer or Hootsuite help schedule posts and analyze performance across platforms.
- Sprout Social or Sprinklr provide cross-platform dashboards that compare conversion rates between channels.
Denver-specific insights for your business
Local businesses benefit from strategies that account for regional preferences. Use geotargeting for Denver neighborhoods like Cap Hill, Highlands, and Cherry Creek. Include local trust signals such as “Denver business” or “Colorado-owned” in your messaging.
Schedule posts during lunch hours between 11 AM and 2 PM Mountain Standard Time when engagement peaks. Evening engagement rises again between 7 PM and 9 PM. Denver’s outdoor lifestyle means content featuring Colorado landscapes or mountain activities generates higher engagement than generic imagery.
Social media conversion optimization checklist
- Define your conversion goals with specific monthly targets
- Set up pixels and tracking URLs before launching campaigns
- Align creative with landing page messaging and visuals
- A/B test headlines, images, and calls-to-action systematically
- Monitor weekly performance every Monday morning
- Retarget and refresh campaigns every 30 days
- Document learnings in a spreadsheet for future reference
Consistent application of these principles improves conversion rates more than one-time optimization efforts. Review this checklist monthly as your campaigns scale.
Phần kết luận
A strong social media conversion rate means your marketing dollars work hard for your business. Clear goals, accurate tracking, and continuous optimization transform engagement into measurable growth.
Denver businesses and national brands alike benefit from systematic conversion optimization. Start with proper tracking setup. Define conversion goals that match your business model. Test different creative approaches to find what resonates. Monitor results weekly to catch trends early. Adjust campaigns based on data rather than assumptions.
Ready to boost your social media conversions? Call Đại dương rộng lớn at (720) 334-0899 or email [email protected] for your free consultation today. Your journey to sustainable growth starts with a single conversation.
Frequently asked questions (FAQs)
What is a good social media conversion rate?
Most campaigns achieve 2 to 5% conversion rates. High-performing campaigns can exceed 10%. Your industry, product price point, and campaign type all affect what constitutes good performance. Compare your results against your own baseline rather than generic benchmarks.
How do I know which platform converts best?
Run platform-specific tests to identify your best channels. LinkedIn typically converts well for B2B services. Instagram works better for e-commerce and visual products. TikTok excels at awareness but may need longer nurture sequences for conversions. Track each platform separately for three months to establish reliable patterns.
What’s the biggest mistake marketers make?
Failing to align landing pages with ad messaging creates the biggest conversion killer. Users expect continuity from ad to landing page. Broken tracking setup comes in second. Without proper pixels and UTM codes, you can’t measure what works or optimize effectively.
Can small businesses compete with big brands?
Localized targeting and authentic content often outperform large-scale generic campaigns. Small businesses can speak directly to Denver audiences with relevant local references. Personal service and genuine customer relationships build trust that big brands struggle to replicate at scale.
How often should I analyze my conversion rate?
Review active campaigns weekly to catch performance shifts early. Look at monthly trends to identify seasonal patterns. Quarterly reviews help you understand longer-term strategy effectiveness. Balance frequent monitoring with giving campaigns enough time to gather meaningful data.
